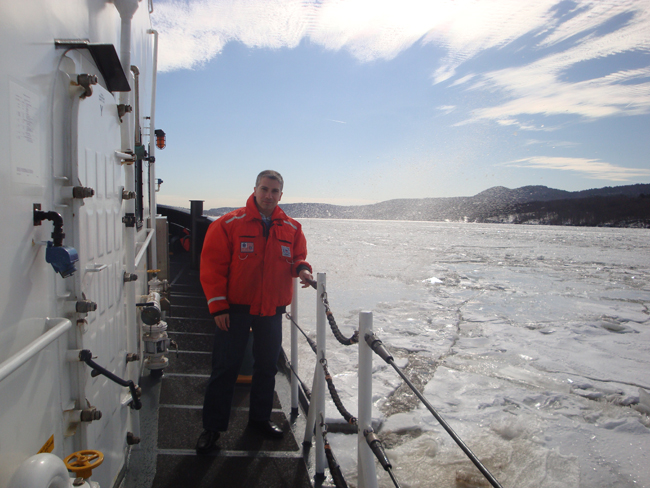
Professor Nickitas Georgas surveying Hudson River conditions on the coastal ice cutter Sturgeon Bay. Credit: Nickitas Georgas
— By Chris Gonzales, Communications Specialist, New York Sea Grant
Stony Brook, NY, September 21, 2017—Scientists have been using a detailed computer model to predict changes in ocean conditions and forecast the dangers of storm surges around the Long Island Sound and New York and New Jersey Harbor Estuaries. Research on the existing model, called the New York Harbor Observing and Predicting System (NYHOPS), has shown that the model skillfully predicts storm surges from incoming storms in the region’s coast. Predictions are displayed online at www.stevens.edu/SFAS.
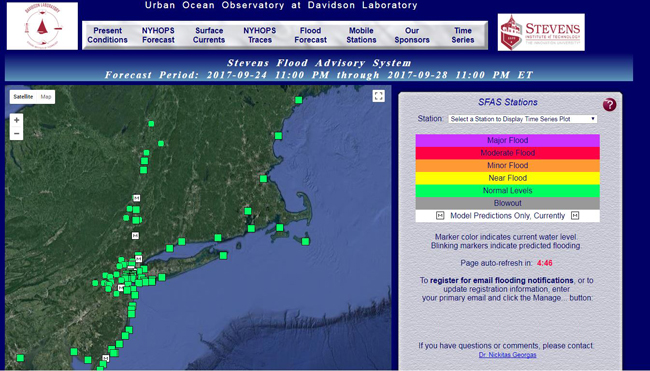
Climate-Georgas-StevensFloodAdvisorySystem-0917.jpg
The scientists recently tested how accurate the model was in predicting shifts in ocean conditions for a period of 30 or so years up to 2012 by comparing the model to actual observations. Nickitas Georgas of the Stevens Institute of Technology in Hoboken, New Jersey led the team of researchers, with funding from the New York and Connecticut Sea Grant programs. Vince Saba from the National Oceanic and Atmospheric Administration’s Fisheries Service (NOAA Fisheries) and Penny Howell, who recently retired from the Connecticut Department of Energy and Environmental Protection (CT DEEP), were also members of the science team.
As Georgas and his team worked, they increased the fidelity of the model’s inputs and physics, telling it how to respond to unusual events such as storms, floods, hurricanes, periods of heavy runoff and discharge from sewage treatment plants. The investigators proceeded in this fashion in order to reproduce, as well as they could, day-to-day coastal ocean conditions between 1979 and 2013. This special simulation is called a historic hindcast.
Accurate model
In the end, the model’s predictions of daily water temperatures near the bottom of the Long Island Sound proved to be consistent with independent CT DEEP trawl survey observations. Georgas’ hindcast model results verified that the Sound’s water temperature had become approximately 1 degree Celsius warmer than 30 years ago. (1)
"This is a significant and encouraging finding for multi-decadal model applications used to identify climatic changes,” said Georgas. “The hope is that if such detailed models can reproduce changes in the past coastal climate well, they may also be able to forecast the future skillfully under a changing climate, which is of course one of the major goals of our scientific quest."
Data from the model also revealed that the Sound has become fresher by 0.4 practical salinity units over the last three decades. Georgas points to increasing freshwater inputs from the region’s major rivers as a probable cause.
“The model was able to produce hydrodynamics reasonably well,” Georgas wrote in an article published in the Journal of Marine Science and Engineering (2). Water temperatures, for the most part, fell along the 1:1 line, meaning the hindcast worked well in tricky estuarine areas like Long Island Sound and the New York Harbor where ocean water and river plumes meet and mix. The few discrepancies were due to things like sewer outflows and small tidal tributaries where researchers lacked data. Nevertheless, overall the hindcast proved excellent. The scientists measured the skill of their model’s prediction using a scale from zero to one, where one meant absolute validity. Scientifically speaking, the Wilmott Index of Agreement, or W.I. in scientific terms, was 0.99 for water temperature and 0.95 for salinity. The overall hindcast results are well within NOAA standards and skill metrics for water temperature and salinity, a testament to the model’s accuracy.

Water level sensor installation JPG: Coastal engineers and students from the Stevens Institute of Technology participate in the deployment of a new sensor measuring tides and storm surges in the Passaic River. Credit: Nickitas Georgas
Surge and Climate Shifts
The average W.I. for the storm surge (the predicted hour to hour tidal departure along the coast) was 0.93. The model performed well in its prediction of coastal water levels, although forecasts strayed somewhat against hourly observations during some major storm events and Atlantic hurricanes, especially during the early years of the simulation. For example, the storm surges during the Nor’Easter of March 1984 and Hurricane Gloria in 1985 were under-predicted.
The biggest storm surge of the last three decades happened during Superstorm / Hurricane Sandy in 2012. The model under-predicted the storm surge by about 20 percent at some locations for Sandy. Georgas hypothesizes that this under-prediction may be due to the winds used to force the ocean in this long model run not being detailed enough. Wind fields used for the hindcast came from a national historic data set called the North American Regional Reanalysis (NARR), which may have lacked enough observations during the 1970s and 1980s, and may be short on the high spatial and temporal resolution needed to resolve some storms.
"NARR holds information for winds and other important storm-related meteorological conditions every 36 km and every 3 hours," said Georgas. "In contrast, storm surge predictions in our operational NYHOPS storm surge forecasts displayed online are based on 100 different possible future wind fields that change every 2 km and every 15 minutes."
The findings have implications for fisheries management. Failure to account for shifts in climate that can alter marine population dynamics can lead to stock collapse as has happened with the Gulf of Maine cod fishery. The Gulf of Maine has also seen a similar increase in bottom water temperatures like the one found for Long Island Sound. Not everything is negative, though. As some species move further north in warming waters, the Gulf’s lobster fishery is booming.
Interested parties can access the researchers’ data online. They can see, for example, how different yesterday and the next three days are predicted to be from a climatological average based on their 30-year simulation. Researchers say this will enable near-term tracking of anomalous patterns in Long Island Sound.
References
(1) Water temperatures (0.34 ± 0.08 °C per decade) have all seen significant increases between 1981 and 2013, more so on the shallower north shore and western Sound than the south shore. The basin wide average is comparable to the 0.30 °C per decade rate reported for sea surface temperature.
(2) Georgas, N., et al. 2016. An Open-Access, Multi-Decadal, Three-Dimensional, Hydrodynamic Hindcast Dataset for the Long Island Sound and New York/New Jersey Harbor Estuaries. J. Mar. Sci. Eng. 4, 48; doi:10.3390/jmse4030048
More Info: New York Sea Grant
New York Sea Grant (NYSG), a cooperative program of Cornell University
and the State University of New York, is one of 33 university-based
programs under the National Sea Grant College Program (NSGCP) of the
National Oceanic and Atmospheric Administration (NOAA). The NSGCP
engages this network of the nation’s top universities in conducting
scientific research, education, training and extension projects designed
to foster science-based decisions about the use and conservation of our
aquatic resources. Through its statewide network of integrated
services, NYSG has been promoting coastal vitality, environmental
sustainability, and citizen awareness about the State’s marine and Great
Lakes resources since 1971.
New York Sea Grant maintains Great Lakes offices at SUNY Buffalo, the
Wayne County Cooperative Extension office in Newark and at SUNY Oswego.
In the State's marine waters, NYSG has offices at Stony Brook University
and Stony Brook Manhattan, in the Hudson Valley through Cooperative
Extension in Kingston and at Brooklyn College.
For updates on Sea Grant activities: www.nyseagrant.org has RSS, Facebook, Twitter, and YouTube links. NYSG produces a monthly e-newsletter, "NOAA Sea Grant's Social Media Review," via its blog, www.nyseagrant.org/blog. Our program also offers a free e-list sign up via www.nyseagrant.org/coastlines for its flagship publication, NY Coastlines/Currents, which is published 1-2 times a year.