So far, investigators who have been identifying and linking up some 12 million tweets sent during Hurricane Sandy—cataloging them by frequency of use of term—has yielded some interesting insights for everyday people and emergency managers alike.
- Peg Van Patten, Communications Director, Connecticut Sea Grant
Mississippi State, MS, November 27, 2014 - Word spreads not only quickly these days, but instantaneously, via online social media — thus the term "viral," referring not to a disease but to great numbers of people circulating a digital message. Just ask the 16 million people who have viewed Jimmy Kimmel’s eight and latest “Celebrities Read Mean Tweets” segment on YouTube since its release just a week prior.
Twitter users learn to be brief, since messages cannot exceed 140 characters. During an emergency such as an extreme life-threatening weather event, people talk on social media platforms such as the popular Twitter. Even when electricity is down, users can often access social media from their cell phones.
Researchers led by
John F. Edwards, director of the Survey Research Laboratory at Mississippi State University's Social Science Research Center, are trying to find patterns and make sense of social media messages that were sent from Connecticut, New Jersey and New York just before, during, and after the impact of Superstorm Sandy. The project is part of the NOAA Sea Grant Coastal Storm Awareness Program underway.
Edwards' team, which includes assistant research professor
Somya Mohanty and
Patrick J. Fitzpatrick, a meteorologist at Mississippi State and the Stennis Space Center, understand that modern communication does not follow the old model of message to listener, but rather a new model that involves one message reaching a network of people simultaneously. Using a Social Media Tracking and Analysis System that was developed after Katrina, they have analyzed a network of 12 million Tweets that were sent from the tri-state area in the Northeast. Each Tweet is geo-referenced (located spatially as on a map) and connected to its recipients and "shares."
 Connectivity of Twitter users during Hurricane Sandy
So far the project has yielded some interesting insights. For example, the size of the node on the visualization indicates how frequently something was mentioned or retweeted, and colors show clusters of users. This allows the identification of prominent users mentioned during the event. Data analysis shows that The Weather Channel's twitter feed was the most-used source. News agencies, such as CNN, New York Post, Mashable, and Huffington Post were also frequently used as sources of information, as were federal agencies such as FEMA and NOAA. Politicians, notably then-NYC Mayor Mike Bloomberg, Barack Obama, New Jersey Governor Christie and NJ Senator Cory Booker were also among the most circulated sources. The mapped data also shows the region where a large Spanish-speaking cluster is located.
Word collation shows what people were concerned about in their messages; not so surprisingly, "Sandy." "safety." and "Power still out" were most frequently tweeted.
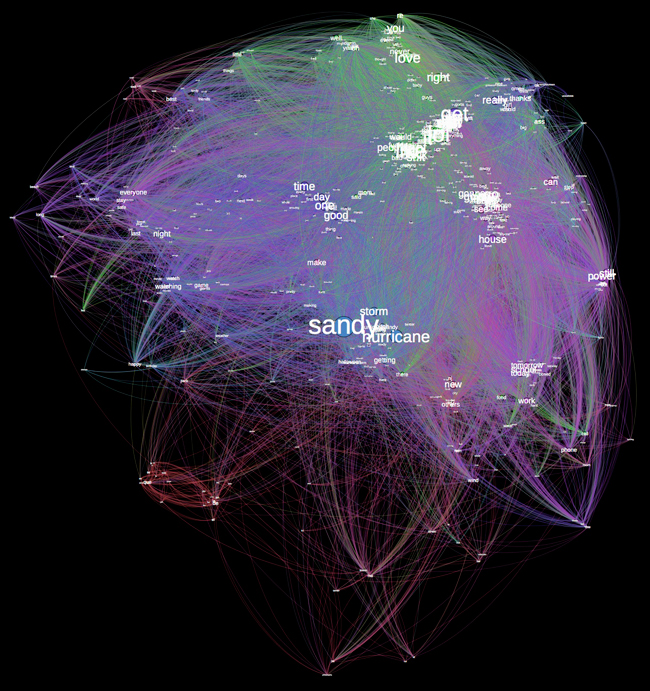 Word collation during Hurricane Sandy
The ultimate goal of this project, which will be completed next Spring, is to help emergency managers better understand how this type of communication can be most effectively used to help people cope with extreme weather events.
For more information, see the
researchers' blog.