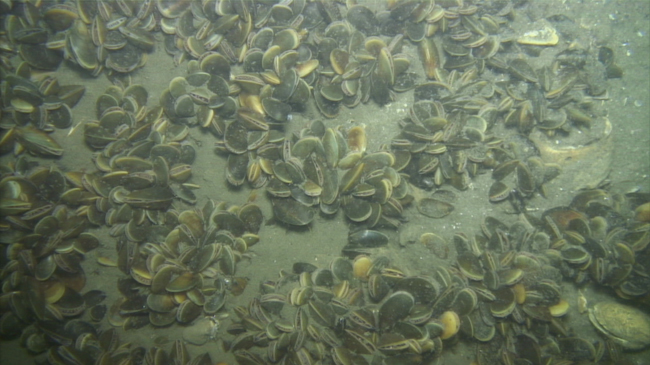
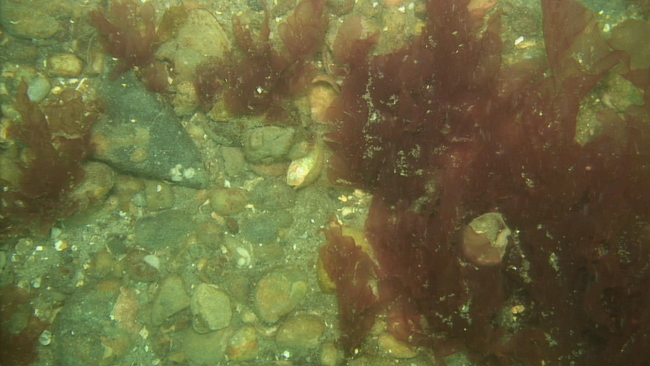
The sea bottom is seldom uniform and can vary across small distances. These photos, taken at Jamaica Bay, New York (above) and Shelter Island, NY (below), represent an area of the seafloor of about 7 x 12 inches. Credit: Alison Flanagan.
— By Chris Gonzales, Freelance Science Writer, New York Sea Grant
Stony Brook, NY, March 24, 2019 - Imagine for a moment that different habitats exist between ripples in the sand on the seafloor. Some scientists are making detailed maps of the sea bottom that might just show this. In fact, microhabitats of a size less than a square meter might contain more variation in the diversity of organisms living there than habitats the size of a few square kilometers.
“The number and types of species can change substantially over relatively short distances along the seafloor,” said Alison Flanagan of Stony Brook University. “This is likely driven by predation and competition, patchiness in larval settlement, and small-scale changes in the environment itself.”
In a recent article published in PLoS ONE by Flanagan and her colleagues, the authors ask how well marine scientists, statistically, describe reality. What if samples are drawn from very geographically distant locations? Do they tell us about the whole, or would two distant samples just tell us about those two distinct locales?
The study, funded by New York Sea Grant, is part of a larger effort to protect coastal habitat and resources. From the outset, the scientists wanted to ensure that sampling and analysis are more meaningful, not arbitrary, and reflect the scales that are relevant in regard to the undersea creatures being investigated.
The investigators suggest that incorporating spatial scale into statistical models will help us better understand the organisms in benthic communities—at the bottom of any body of water—and the conditions diverse creatures need to thrive.
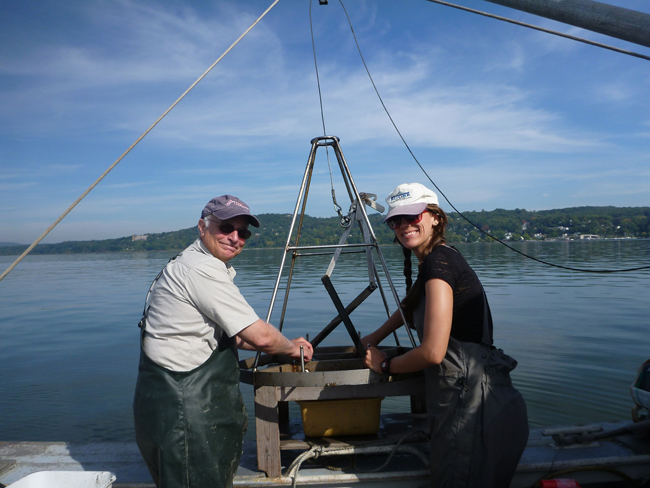
Marine scientists Robert Cerrato (left) and Alison Flanagan (right) prepare to collect organisms from the seafloor using a bottom grab sampling device. Credit: Alison Flanagan.
I’d like to be under the sea
Flanagan and her colleagues analyzed data sets from five study locations in New York State, varying from the freshwater environments of Kingston-Saugerties, the brackish waters of Haverstraw Bay and Tappan Zee, to the near-marine locales of Robins Island and Shelter Island.
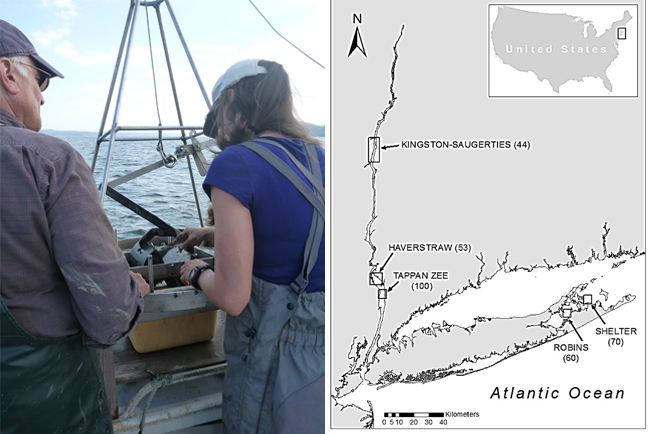
(At left) Cerrato and Flanagan prepare to collect organisms from the seafloor using a bottom grab sampling device; (At right) Map of study areas including the number of samples within each location in parentheses. Credit: Alison Flanagan.
They then segmented each site into smaller regions with apparently similar features, gathering detail from samples about water depth, sediment grain size, the type of surface cover at the bottom, and the abundances of species that live on or within the seafloor.
The investigators created detailed maps of the seafloor, including information about what kinds of ocean creatures lived there. The team created "variograms," illustrations that show how the abundance of different types of creatures varied between locations separated by different distances.
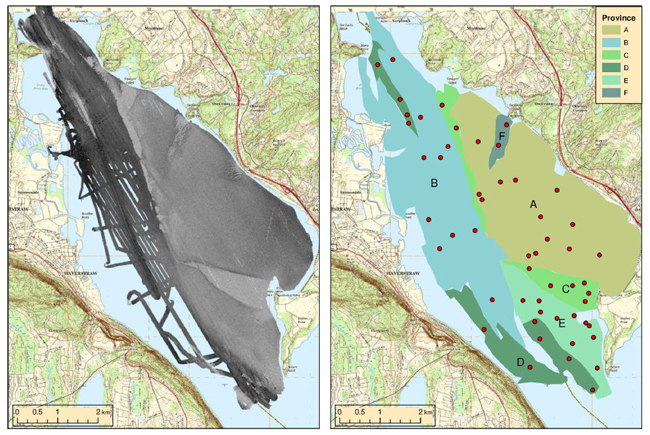
Raw seafloor mapping data collected using backscatter and sonar was used to create this interpretation of provinces at Haverstraw Bay. Points indicate the location of sampling stations. Credit: Basemap from https://nationalmap.gov.
They sang and danced when they found ...
Not only did they find an abundant and diverse array of fauna at each study site, they found that the estimates of small-scale variability represented a substantial proportion (36-59%) of the total community variation across all data sets analyzed. Thus, much of the variability occurred at the smallest sampled level, tens of meters or less, and small-scale variability was a dominant characteristic in the habitats studied.
“Curiously, it was the broad-scale seascapes (or “provinces”) identified using seafloor mapping techniques in this study that had the greatest potential for explaining community patterns, not intermediate-scale environmental factors such as water depth and sediment type,” said Flanagan. “Our results highlight a number of challenges associated with characterizing bottom communities. The identification of seascapes represents one promising pathway towards explaining patterns in and ultimately managing these habitats.”
This finding is significant for aquatic research. It shows that in order to identify submerged habitats, it may require us to have a prior knowledge—information gained from seafloor mapping before we even begin collecting site data—of the important spatial scales of variability.
Implications for conservationists
The authors write that no general method exists for predicting the effects on variance of regions defined with such complexity—of different shapes, extents, and sampling intervals.
None of the habitats they looked at were arbitrary: they were explained by commonly collected environmental variables. However, a large fraction of the community variation (36-59%) was below the resolution of the surveys. Variation within the provinces was only moderately explained in four of the six data sets, but variation between provinces was well explained.
This means that understanding those tiny underwater habitats—regions of less than 10 meters—might be more significant than previously thought. And when it comes to tracking, say, pollutants or pest species, studying these environments at the seascape level might be the new stage where we sing our tune.
References
Flanagan AM, Flood RD, Frisk MG, Garza CD, Lopez GR, Maher NP, et al. (2018) The relationship between observational scale and explained variance in benthic communities. PLoS ONE 13(1): e0189313. https://doi.org/10.1371/journal.pone.0189313
More Info: New York Sea Grant
New York Sea Grant (NYSG), a cooperative program of Cornell University
and the State University of New York (SUNY), is one of 33 university-based
programs under the National Oceanic and Atmospheric Administration’s
National Sea Grant College Program.
Since 1971, NYSG has represented a statewide network of integrated
research, education and extension services promoting coastal community
economic vitality, environmental sustainability and citizen awareness
and understanding about the State’s marine and Great Lakes resources.
Through NYSG’s efforts, the combined talents of university scientists
and extension specialists help develop and transfer science-based
information to many coastal user groups—businesses and industries,
federal, state and local government decision-makers and agency managers,
educators, the media and the interested public.
The program maintains Great Lakes offices at Cornell University, SUNY
Buffalo, SUNY Oswego and the Wayne County Cooperative Extension office
in Newark. In the State's marine waters, NYSG has offices at Stony Brook
University in Long Island, Brooklyn College and Cornell Cooperative
Extension in NYC and Kingston in the Hudson Valley.
For updates on Sea Grant activities: www.nyseagrant.org has RSS, Facebook, Twitter, and YouTube links. NYSG offers a free e-list sign up via www.nyseagrant.org/nycoastlines for its flagship publication, NY Coastlines/Currents, which is published quarterly. Our program also produces an occasional e-newsletter,"NOAA Sea Grant's Social Media Review," via its blog, www.nyseagrant.org/blog.