— Compiled by Paul C. Focazio, New York Sea Grant
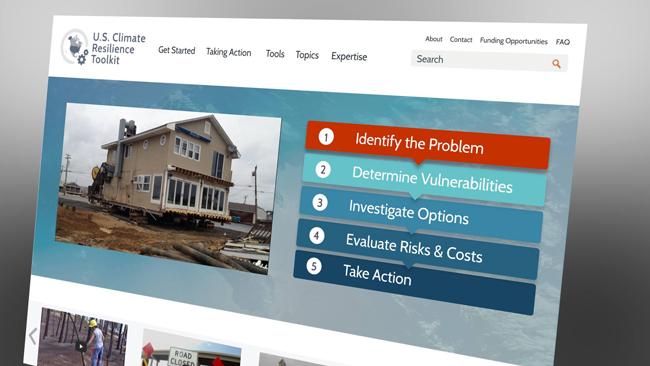
The Climate Resilience Toolkit provides data-driven tools, information
and subject-matter expertise to help communities prepare for a change
world. Photo: NOAA.
Washington, D.C., December 14, 2014 - It's been quite a packed
second-half of 2014 for discussions on the topic of climate change.
First, in mid-November, the National Oceanic and Atmospheric Administration (NOAA, Sea Grant's federal funding agency) developed a new Climate Resilience Toolkit that was unveiled by the White House to "help prepare America for a changing world."
The online toolkit offers information from across the federal government in one easy-to-use location, so that Americans are better able to understand the climate-related risks and opportunities impacting their communities and are given the tools to take steps to improve their resilience.
For many Americans, adapting to new climate regimes means developing new expertise. Decision-makers across the nation are using data and tools to reduce their risks and protect their investments from climate.
Some of the features of the new Web-based toolkit include:
- The Climate Explorer: A visualization tool that offers maps of climate stressors and impacts, as well as interactive graphs showing daily observations and long-term averages from thousands of weather stations across the nation.
- Steps to Resilience: A 5-step process that users can follow to initiate, plan and implement projects to help make their homes, communities, and infrastructure more resilient to climate-related hazards.
- “Taking Action” Stories: More than 20 real-world case studies describing climate-related risks and opportunities that communities and businesses face, steps they’re taking to plan and respond, and tools and techniques they’re using to improve resilience.
- Federal Resource Database: The Toolkit provides centralized access to federal sites for future climate projections, as well as freely available tools for accessing and analyzing climate data, generating visualizations, exploring climate projections, estimating hazards and engaging stakeholders in resilience-building efforts.
You can access the online U.S. Climate Relience Toolkit, check out NOAA's related press release and learn more about "climate resiliency" (as well as NOAA's Monthly U.S. Climate Reports) anytime at NOAA Climate.Gov on Facebook and Twitter.
NOAA's State of Climate
Also, NOAA's National Climatic Data Center rounds up significant climate anomalies and events each month; regional climate outlooks every quarter; and temperature, precipitation and storm outlooks before the start of a new season. New York Sea Grant summarizes many of these regular features via its "Social Media Week In Review," which it publishes several times a month via Facebook and Twitter. NYSG also has a climate news archive via its Web site at www.nyseagrant.org/climate.
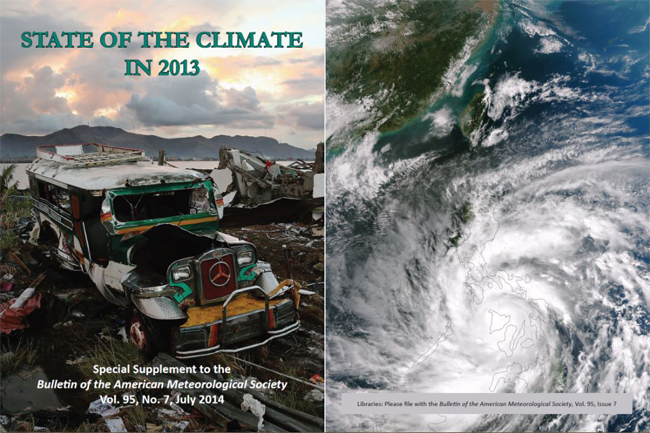
In mid-July, NOAA offered its most recent round of major annual climate findings: (1) Data from air, land, sea and ice in 2013 reflect trends of a warming planet; (2) Increases in temperature, sea level and CO2 have been observed; and (3) Southern Hemisphere warmth and Super Typhoon Haiyan were among 2013’s most notable events.
In 2013, The vast majority of worldwide climate indicators — including greenhouse gases, sea levels, and global temperatures — continued to reflect trends of a warmer planet, according to the indicators assessed in the State of the Climate in 2013 report, released online today by the American Meteorological Society.
Scientists from NOAA’s National Climatic Data Center in Asheville, N.C., served as the lead editors of the report, which was compiled by 425 scientists from 57 countries around the world (highlights, visuals, full report). It provides a detailed update on global climate indicators, notable weather events, and other data collected by environmental monitoring stations and instruments on air, land, sea, and ice.
“These findings reinforce what scientists for decades have observed: that our planet is becoming a warmer place,” said NOAA Administrator Dr. Kathryn Sullivan. “This report provides the foundational information we need to develop tools and services for communities, business, and nations to prepare for, and build resilience to, the impacts of climate change.”
The report uses dozens of climate indicators to track patterns, changes, and trends of the global climate system, including greenhouse gases; temperatures throughout the atmosphere, ocean, and land; cloud cover; sea level; ocean salinity; sea ice extent; and snow cover. These indicators often reflect many thousands of measurements from multiple independent data sets. The report also details cases of unusual and extreme regional events, such as Super Typhoon Haiyan, which devastated portions of Southeast Asia in November 2013.
Highlights from the report include:
- Greenhouse gases continued to climb: Major greenhouse gas concentrations, including carbon dioxide (CO2), methane and nitrous oxide, continued to rise during 2013, once again reaching historic high values. Atmospheric CO2 concentrations increased by 2.8 ppm in 2013, reaching a global average of 395.3 ppm for the year. At the Mauna Loa Observatory in Hawaii, the daily concentration of CO2 exceeded 400 ppm on May 9 for the first time since measurements began at the site in 1958. This milestone follows observational sites in the Arctic that observed this CO2 threshold of 400 ppm in spring 2012.
- Warm temperature trends continued near the Earth’s surface: Four major independent data sets show 2013 was among the warmest years on record, ranking between second and sixth depending upon the data set used. In the Southern Hemisphere, Australia observed its warmest year on record, while Argentina had its second warmest and New Zealand its third warmest.
- Sea surface temperatures increased: Four independent data sets indicate that the globally averaged sea surface temperature for 2013 was among the 10 warmest on record. El Niño Southern Oscillation (ENSO)-neutral conditions in the eastern central Pacific Ocean and a negative Pacific decadal oscillation pattern in the North Pacific had the largest impacts on the global sea surface temperature during the year. The North Pacific was record warm for 2013.
- Sea level continued to rise: Global mean sea level continued to rise during 2013, on pace with a trend of 3.2 ± 0.4 mm per year over the past two decades.
- The Arctic continued to warm; sea ice extent remained low: The Arctic observed its seventh warmest year since records began in the early 20th century. Record high temperatures were measured at 20-meter depth at permafrost stations in Alaska. Arctic sea ice extent was the sixth lowest since satellite observations began in 1979. All seven lowest sea ice extents on record have occurred in the past seven years.
- Antarctic sea ice extent reached record high for second year in a row; South Pole station set record high temperature: The Antarctic maximum sea ice extent reached a record high of 7.56 million square miles on October 1. This is 0.7 percent higher than the previous record high extent of 7.51 million square miles that occurred in 2012 and 8.6 percent higher than the record low maximum sea ice extent of 6.96 million square miles that occurred in 1986. Near the end of the year, the South Pole had its highest annual temperature since records began in 1957.
- Tropical cyclones near average overall / Historic Super Typhoon: The number of tropical cyclones during 2013 was slightly above average, with a total of 94 storms, in comparison to the 1981-2010 average of 89. The North Atlantic Basin had its quietest season since 1994. However, in the Western North Pacific Basin, Super Typhoon Haiyan – the deadliest cyclone of 2013 – had the highest wind speed ever assigned to a tropical cyclone, with one-minute sustained winds estimated to be 196 miles per hour.
State of the Climate in 2013 is the 24th edition in a peer-reviewed series published annually as a special supplement to the Bulletin of the American Meteorological Society. The journal makes the full report openly available online.
"State of the Climate is vital to documenting the world's climate," said Dr. Keith Seitter, AMS Executive Director. "AMS members in all parts of the world contribute to this NOAA-led effort to give the public a detailed scientific snapshot of what's happening in our world and builds on prior reports we've published."
More Info:
New York Sea Grant (NYSG), a cooperative program of Cornell University
and the State University of New York, is one of 33 university-based
programs under the National Sea Grant College Program (NSGCP) of the
National Oceanic and Atmospheric Administration (NOAA). The NSGCP
engages this network of the nation’s top universities in conducting
scientific research, education, training and extension projects designed
to foster science-based decisions about the use and conservation of our
aquatic resources. Through its statewide network of integrated
services, NYSG has been promoting coastal vitality, environmental
sustainability, and citizen awareness about the State’s marine and Great
Lakes resources since 1971.
For updates on Sea Grant activities: www.nyseagrant.org has RSS, Facebook, Twitter, and YouTube links. NYSG also offers a free e-list sign up via www.nyseagrant.org/coastlines for NY Coastlines, its flagship publication, which merged with our e-newsletter, Currents, in 2014 - is published several times a year.